Graphical output
When a
classifyorto_taxonomycommand is executed, raw summary files are produced (as described in Classification) and a phylotree is also produced as a graphical depiction of the sample summary.This graphical representation has some customisable features:
Multiple samples can be plotted on the same tree, with different colours for different samples.
Sample results can be grouped together to appear as one on the tree.
Shown below is an example graphical output.
If no colours are supplied (see below), a random colour is chosen for each sample.
Colours are shaded based on how prevalent any given clade is.

Figure 1: Example phylotree.
One tree is produced for each type of results - complete classifications and splits.
Features and CLI
Sample names in the following refer to the original input file without any sequence or compression file extensions.
For instance, sample_one.fq.tar.gz \(\rightarrow\) sample_one.
Groups
- --group <hex_colour (optional)> <sample_one> <sample_two> ...
Group together classifications in samples
sample_one,sample_twoand so on. This is done both in sample summary files, and on the ouptut phylotree.Optionally, a hex colour string can be supplied just after the
--groupflag to assign a colour to this group.
Warning
When specifying a colour for each group, this should be enclosed in quotation marks. Otherwise, the command line will treat the rest of the command as a comment (and be ignored).
Example of grouping
Say we have six samples to be profiled and grouped -
a1,a2,a3,b1,b2,b3.
$ expam classify ... --group a1 a2 a3 --group b1 b2 b3
$ expam classify ... --group "#FF0000" a1 a2 a3 --group "#00FF00" b1 b2 b3
Note
In the sample summary files, the combined groups will be referred to by the first member specified in the group (without file extensions).
Note
On paired-end data.
When grouping paired-end data, only refer to the alphabetically smaller sample name when declaring group members.
Say we are grouping
a1_f.fq,a1_r.fq,a2_f.fq,a2_r.fq,
b1_f.fq,b1_r.fq,b2_f.fq,b2_r.fq.
We could do so through
$ expam classify ... --paired --group a1_f a2_f --group b1_f b2_f
Visual flags
- --phyla
Colour the perimeter of the tree with colours associated with the four main bacterial phyla (Actinobacteria, Bacteroidetes, Firmicutes, Proteobacteria).
- --ignore_names
Do not add reference genome names to the perimeter of the phylotree.
- --colour_list
Instead of randomly assigning colours to each sample, you can supply a list of colours, which will be taken in the supplied order.
Note
If both
--colour_listand a colour declared with the group are supplied, the colour declared next to--groupis given priority.
Example of colour list
$ expam classify ... --colour_list "#FF0000" "#00FF00" "#0000FF"
iTOL integration
Rather than use ete3 for visualising classification results, supplying the
--itol flag will instead create a itol subdirectory within the output
folder containing two files:
tree.nwk- Newick format tree that can be inserted into iTOL.style.txt- An iTOL formatted text document that contains all the information needed for iTOL to style the tree.
For instance, say we previously ran expam classify --out my_run -d /some/samples, and
now run expam phylotree --out my_run --itol, the corresponding files
would be located at
my_run/itol_classified/tree.nwk,my_run/itol_classified/style.txt,my_run/itol_splits/tree.nwk,my_run/itol_splits/style.txt.
To use these files,
Create a new tree in iTOL with
tree.nwk.Open this tree using the iTOL interface.
Drag-and-drop the
style.txtinto the open tree interface, and iTOL will colour the tree accordingly.
Note
By default, iTOL will only colour the leaf labels and clades with the supplied colours. Using the Colored ranges window that appears after dragging the style sheet onto the tree, you can select the Cover –> Clade option for more effective highlighting of the distributions.
An example is shown below.
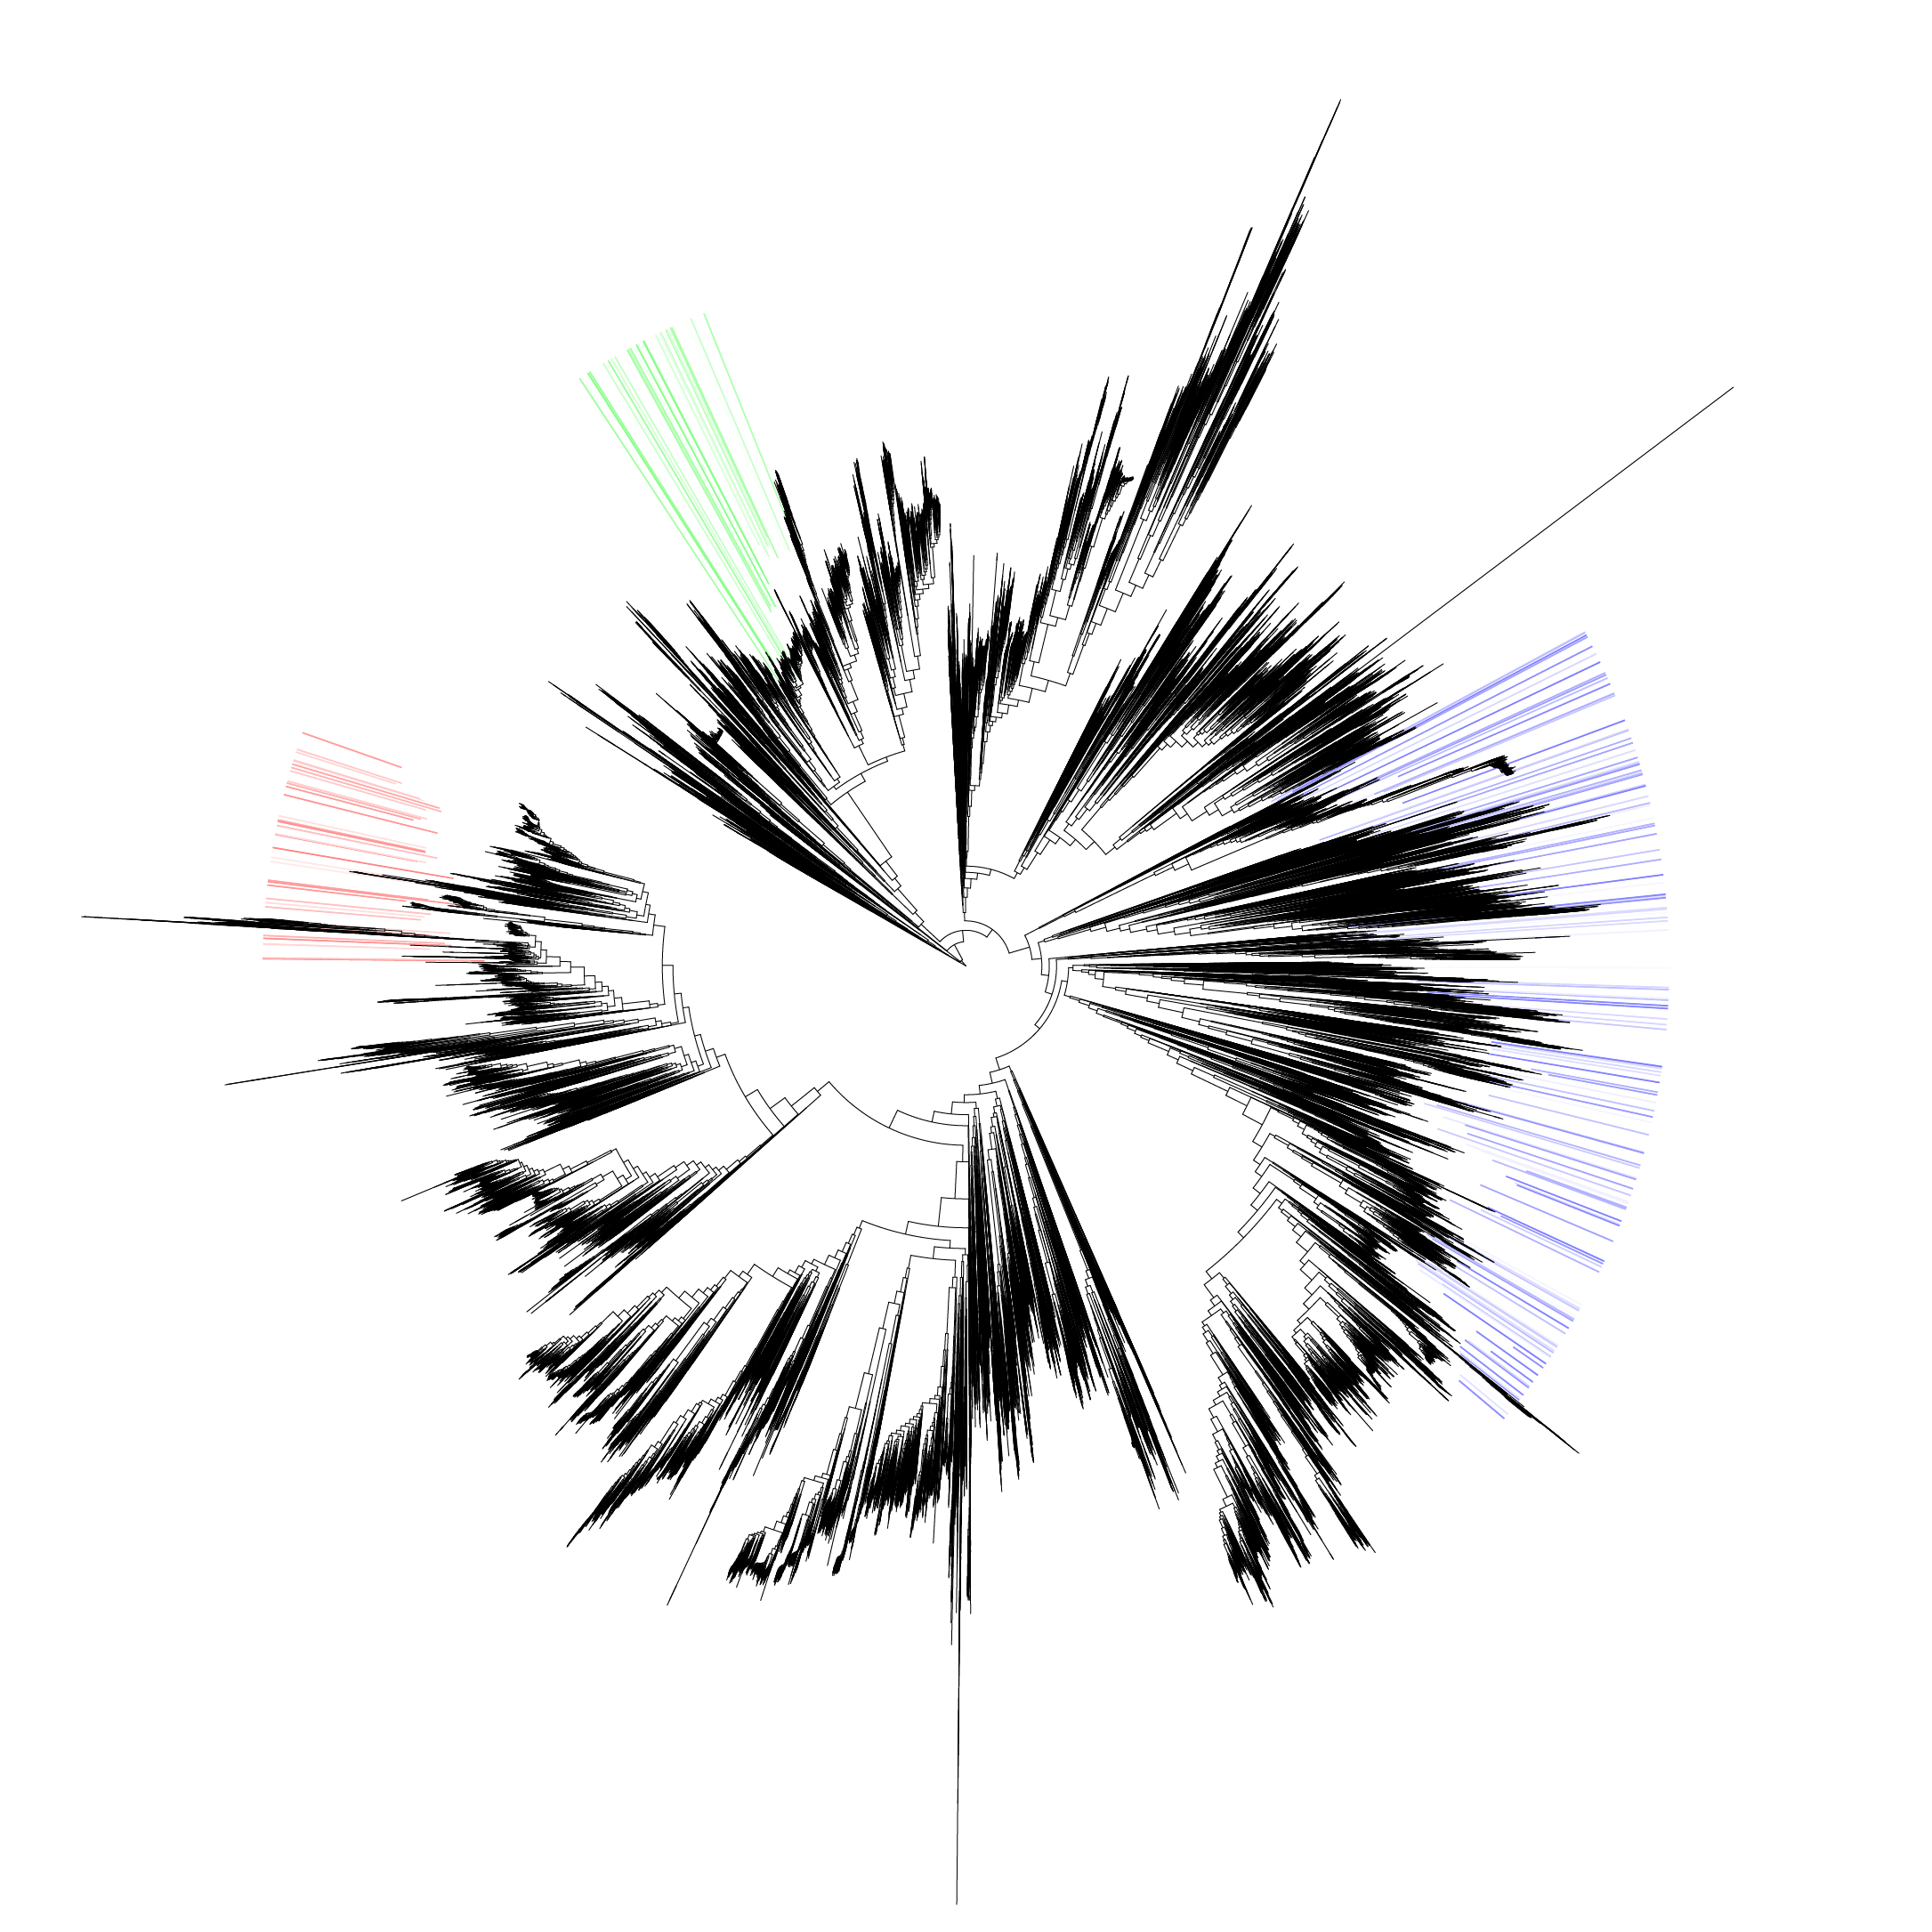
Figure 2: Example tree containing three different sample classification results plotted in red, green and blue shades respectively.